


Kolabtree freelance statistician Kingsley Ukwuoma writes about the top statistical tools used in medical research and clinical data analysis.
There was a time when validating experiments through data was done fully using manual computation. This opened up gaps for human error and greater cost of carrying out research especially when the data was large by say, over a 1000 field observations. Today, due to the gradual advancement in technology, statistical tools are being used in medical research for greater efficiency and accuracy.
In the medical research field, stretching from systematic reviews, meta-analysis and clinical trials, exactness and precision is paramount. Validation parameters must be more stringent. In testing research hypothesis, the assumption is based on 100% correctness. However, since data in itself is never normally distributed or perfect, it becomes important to apportion a percentage of 0.01 (1%) as the level of significance or margin of error or probability that the result will produce an error, though slight but gets better as the benchmark approaches 100%, in other words, 0.001 (0.1%) or 0.0001 (0.01%).
Data in itself consisting of an admixture of numeric, string and alpha numerical points can appear intimidating but the analysis of data does not have to be always complex. The process can be broken down into 3 clear steps:
-Understand the origin of the data, by way of the research objectives
-What to do with the data (choice of estimation test)
-How to make sense out of the data (interpretation of results)
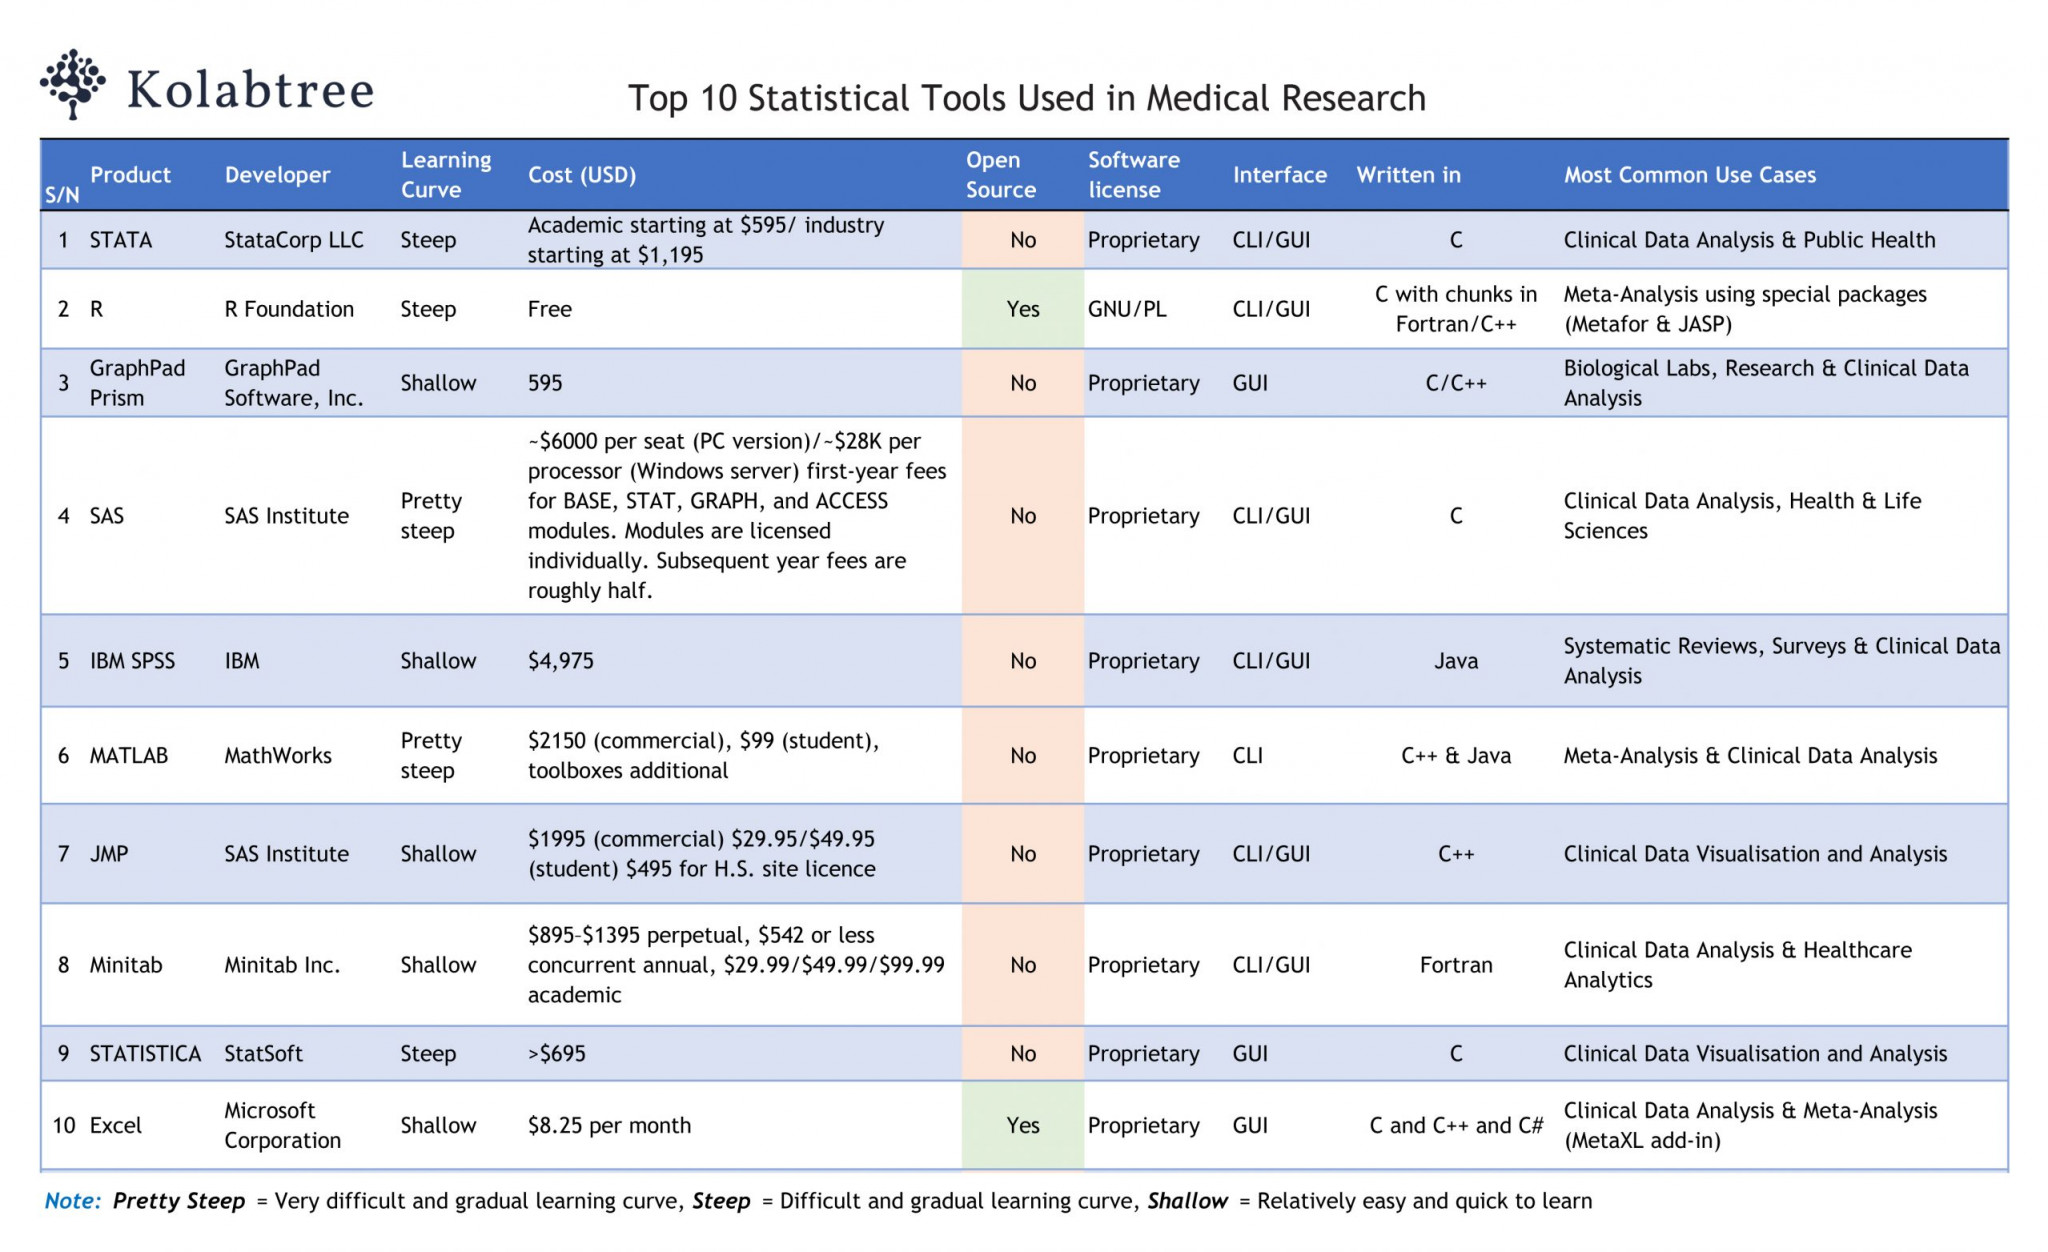
There are a vast universe of statistical tools used in medical research. These tools get the job done in similar ways, but the differences lie in ease of use and presentation as differences in licensing (proprietary or not), interface (point and click or command line) and cost (free or paid). These tools handle the end-to-end processes of collecting, organizing, analyzing and interpreting statistical data. Let’s look at the top 10 statistical tools used in medical research by scientists, physicians and industry R&D professionals.
1. Stata
Stata is a complete toolbox that provides a data management capability, data analysis and a colorful graphical interface. Stata can be termed as the policy statistical software common to institutions, including international organizations like the United Nations, governments and academicians for Public health, Economics, Social Work and Medicine. It remains the most powerful software available in the analytics space. The name Stata is a syllabic abbreviation of the words statistics and data and was released in 1985 and then the graphical user interface option in 2003.
Stata features includes, Graphical user interface (GUI) or simply, point-and-click interface accompanied with an option for command line interface (CLI) which is quick, authentic and easy to use. STATA is compatible with Excel files (.xls, .xlsx), Text files (.txt, .csv, .dat), SAS (.XPT) and Other (.XML).
There are a lot of statistical features, stretching from descriptive analysis, cross tabulation analysis to more advanced techniques like structural equation modeling, probability models, survival analysis, time series and multilevel models. Stata allows users to have control over data, variables and also statistical compilation of groups. Stata works well with longitudinal data but can only hold one dataset in memory which has to rewritten to add or access a new dataset. The Stata graphics are not that flexible when compared to other software and the different packages limits the usable datasets size (Stata/IC, Stata/SE, and Stata/MP).
2. R
R is an open source statistical software tool that is well equipped to handle, visualization, analysis and aspects of machine learning ‘heavy computing’ and it’s strictly a programming ‘command line interface (CLI) software tool though relatively new in the user space, R now commands a strong fan base, boasting over 6000 packages, contributed by data scientists, bioinformatics and medical researchers, covering an expanse of disciplines from cancer research, clinical analysis, molecular biology, phylogeny, to meta-analysis.
The R-studio integrated Development Environment (IDE) which houses the R tools works like the Oracle Data Base Engine where SQL is used. The earlier version was launched in 1993 and the IDE released in 2011. R is compatible with Excel files (.xls, .xlsx), Text files (.txt, .dat, .csv), SPSS (.sav), Stata (.dta), SAS (. sas7bdat), Other (. xml, json). R interacts with other software well with a rather steep learning curve, given the different data types.
Specifically, Metafor is one of the many R packages available to conduct meta-analyses and contains the most comprehensive analysis tools. Their website contains some very useful analysis and plot examples with the corresponding code. However, since the package requires the use of the R environment, it may be difficult for those who have never used R before to become accustomed to the package so quickly. Worthy of mention are the JASP or Jamovi packages.
3. GraphPad Prism
GraphPad Prism is popular among biologists in academia and industry. It also comes with functionalities that allows researchers perform laboratory research and clinical trial test using the t-test, one-way ANOVA, contingency table, survival analysis and probability models like logistic regression model.
The software, unlike any other, comes with an interpreted result analysis page after the estimates have been produced. The language is easy to understand with less technicalities. The software also has an in-built automated feature that combines the analysis and the graphical output in one snapshot – which adds to the pertaining behavior of automatic re-analysis of data in cases where any of the data points are altered, all on runtime without any need to redo the analysis performed or graph drawn.
The software tool is compatible with Excel files (.xls, .xlsx), Text files (.txt, .dat, .csv), and Other (. xml, json). The graphing features are exceptional.
Also read: How Freelance Statisticians can Improve Research
4. SAS
SAS is the bedrock of advanced analytics with functionalities that cuts across diverse array of scientific and engineering enterprises and organizations. The development of SAS (Statistical Analysis System) began in 1966 by Anthony Bar of North Carolina State University and later joined by James Goodnight. The National Institute of Health funded this project with a goal of analyzing agricultural data to improve crop yields.
SAS is compatible with Excel files (.xls), ext files (.txt, .dat, .csv), IBM SPSS (.sav), Stata (.dta), JMP (.jmp), and Other file extensions (.xml). This allows data to be imported and exported with ease without resorting manual processes that may lead to error. SAS also comes with a good interactive Graphic interface. However, SAS can be cumbersome at times to create perfect graphics with syntax.
Some of the down features or benefits of SAS is linked to its size and proprietary license ownership. Key among this, is the time to implementation of new ideas and methods and the technicalities in the documentation process. SAS has gained popularity among Financial Services, Government, Manufacturing and Health and Life Sciences.
5. IBM SPSS
The initial version of SPSS was developed in 1968 until IBM acquisition in 2009. IBM SPSS is quite comprehensive and serves as the go-to tool for almost all disciplines and professional. The software has depth in capability with an easy to use graphical user interface function. However, the software works best for researchers who have a basic knowledge of statistics, most especially data elements like data measurements, data types identification, variable assignment and coding and case selection.
IBM SPSS is compatible with Excel files (.xls, .xlsx), Text files (.csv, .txt, .dat), SAS (. sas7bdat) and Stata (.dta). it comes with a striking feature in ‘Chart Builder’ that allows users to drag and drop graphics and make modifications. Aside from the ease of use and ability to automatically handle missing data points, users get to perform structural equation models through SPSS Amos.
However, some robust and complex statistical methods cannot be estimated for instance, Least Absolute Deviation Regression, and Quantile Regression.
6. MATLAB
MATLAB (The Mathworks) was released in 1984. MATLAB is a complete command line interface (CLI) or programming language used by scientist and engineers. As with R, the learning path is steep, and you will be required to create your own code at some point. A plentiful number of toolboxes are also available to help answer your research questions (such as EEGLab for analysing EEG data). The difficult to use feature is complemented by a vast array of statistical methods and flexibility in terms of what the software can handle. MATLAB gained popularity among scientist in the areas of engineering, numerical analysis, linear algebra and image processing.
MATLAB is compatible with Excel files (.xls, .xlsx), Text files (.txt, .dat, .csv), Other (. xml, json). MATLAB has a good graphic and integrates easily with high-end programming software like Python and C++ but does not boast the huge statistical methods that is available for SAS and IBM SPSS.
Also, there are a list of unpopular statistical software tools out there that does well in term of ease of use, with effective point and click features.
7. JMP
JMP combines powerful statistics with dynamic graphics, in memory and on the desktop. Its interactive and visual paradigm enables JMP to reveal insights that are impossible to gain from raw tables of numbers or static graphs. Originally stood for ‘John’s Macintosh Program’ with five bespoke products: JMP, JMP Pro, JMP Clinical, JMP Genomics and JMP Graph Builder App.
JMP is compatible with Excel files (.xls, .xlsx), Text files (.csv, .txt, .dat), SAS (. sas7bdat), Stata (.dta), SPSS (.sav). JMP comes with an interactive Graphics, dynamically linked data tables and scripting language and also has an interface that allows the use of R and Excel add-ins, Users also get the added benefits of managing output effectively. Similar to IBM SPSS, some essential robust methods: regression; two-stage least squares (2SLS), LAD, Quantile are absent.
8. Minitab
Minitab offers a range of both basic and fairly advanced statistical tools for data analysis and was developed in 1972 from OMNITAB 80 which is a light version. Similar to GraphPad Prism, commands can be executed through both the GUI and scripted commands, making it accessible to novices as well as users looking to carry out more complex analyses.
The software is compatible with Excel files (.xls), ext files (.txt, .dat, .csv), IBM SPSS (.sav), Stata (.dta), JMP (.jmp), and Other file extensions (.xml). This allows data to be imported and exported with ease without resorting manual processes that may lead to error. Minitab automates calculations and allows the efficient creation of graphs.
9. Statistica
Statistica is a suite of analytical software tool originally developed by StatSoft and acquired by Dell in 2014 and TIBCO entering agreement to buy in 2017. Statistica is great with data management, analysis, visualization, data mining and machine learning.
SAS is compatible with Excel files (.xls), ext files (.txt, .dat, .csv), IBM SPSS (.sav), Stata (.dta), JMP (.jmp), and Other file extensions (.xml). This allows data to be imported and exported with ease without resorting manual processes that may lead to error. Statistica allows integration of R programming environment where additional analytical techniques are available.
10. Excel
Microsoft Office Excel is originally developed to handle data management Without any need of introduction, Microsoft Corp Excel is used widely in statistical analysis per the dataset taken for this review. The program has a wider reach and knowledge of use is quite widespread that the amount of unknown is very less about the way-of-use and thus the ease-of-use reaches the highest among the reviewed software.
Excel also has an add-in called Meta-Essentials, MetaXL and MetaEasy which adds the ability to perform meta-analytical statistics with excel as a base.
There are several factors that affect the outcome of analysis, including sample size, data collection methods, choice of test used, methodology, and more. Statistical analysis needs to be carefully done by experts to obtain reliable results. Hiring an experienced freelance medical statistician or biostatistics consultant can help you save time and energy, while focusing on your research. Getting your research data verified before publication is also essential so that you can communicate your research to the world with confidence. Kolabtree offers access to freelance statisticians experienced in different software and tools. View experts now or simply post a project and get quotes in 24 hours.
Kolabtree helps businesses worldwide hire freelance scientists and industry experts on demand. Our freelancers have helped companies publish research papers, develop products, analyze data, and more. It only takes a minute to tell us what you need done and get quotes from experts for free.

Unlock Corporate Benefits
• Secure Payment Assistance
• Onboarding Support
• Dedicated Account Manager
Sign up with your professional email to avail special advances offered against purchase orders, seamless multi-channel payments, and extended support for agreements.


